
‘Information Literacy’ is the ability to find, evaluate, organize, and utilize information to communicate, problem solve, and develop new knowledge. While these skills are relevant to all academic fields, I chose to explore information literacy tools through the lens of science education.
The infographic below was developed by the National Forum on Information Literacy to illustrate the variety of focus areas and skills that fall under the umbrella of information literacy. Visual Literacy is the ability to gain meaning and communicate using visual representations. This is a critical skill used in solving physics problems, as complex mathematical models can be represented visually in many ways to aid the student in understanding physical phenomena. Visual literacy is also essential to interpret data trends portrayed in graphical representations, pictorially illustrate physical influencers (forces, fields, and motion vectors to name a few), and communicate design plans for an experimental apparatus. Despite the broad application of this skill throughout all of science, it stands out as one of the more challenging for students to achieve proficiency in. The tools that I selected to investigate will provide new opportunities for my students to develop their visual literacy skills, as well as promoting growth in the areas of computer literacy and critical thinking.

Tool 1: Physics Interactives (Physicsclassroom.com)
I have referenced this site many times over the years, but generally in the context of providing students with additional resources or practice problem sets. The site has been significantly updated since the last time I really explored it as many tools and simulations have been included. I will be introducing the concept of forces to my classes in the coming weeks, and one of the methods of visually representing forces is a Free Body Diagram (FBD). The idea is to represent an object with a simple shape (box or dot), then draw vectors (lines drawn to scale, where the length of the line is proportional to the magnitude of a force) to represent each force acting on it. This allows the student to visualize the net force (sum of all forces on an object). This applet provided by Physics Classroom allows students to practice the process of making FBDs – it requires both the identification of relevant forces acting on the object, as well as an estimation of the magnitude and direction of those forces. The applet does provide feedback to students and in this way, is an instructive game. I really like this as a tool to help reinforce student skills in creating FBDs. Regrettably, there does not appear to be a way for the teacher to generate a report of student progress, so I would use it as a tool for supplemental practice, not primary instruction. Some of the resources seem to really match a felt need by many students (this kind of practice with FBDs is one of them), while others provide practice for topics where better tools are available. I will likely present the website as a whole for students to use as a supplemental reference as needed, and then remind them of specific activities available when I know there is a useful model that is relevant to a topic we are exploring in class.
Tool 2: Motion Mapper
Motion Mapper is newly released educational game that provides students with a great opportunity to compare the motion of an object to the graph that represents that motion. The ability to create and interpret graphs is a critical visual literacy skill in science, and motion is the first topic that students explore in physics where graphing is a natural application. In a typical school year, I would mark out distances on my classroom floor and have students walk in front of a Vernier range finder to create a graph of their motion in real time. Vernier’s LoggerPro software comes preloaded with several “Position vs Time” and “Velocity vs Time” graphs, and a fun challenge is to have students ‘walk the graph’ by controlling their walking speed and direction so that the graph created by the range finder matches the provided graph. This exercise is helpful as students get familiar with the shapes of motion graphs, how to interpret the slope, and what a graph looks like for an object moving forwards or backwards. In the era of remote learning, this activity was not an option, but fortunately, Motion Mapper provides a great alternative.
Similar to my “walking the graph” activity, students can manipulate the position, velocity, and acceleration of a blue square to match the required graph. The game has two different modes – ‘Input’ and ‘Control’. With Input Mode, students can place the square at an initial position and then set the velocity and/or acceleration values to change at specified times in an effort to match the target graph (the green region in the image below).

The Control Mode allows the student to physically move the blue square through the duration of the level, controlling the speed and direction of motion to keep the plotted graph (yellow/orange line) within the green region in real time. This mode serves as a good introduction as students can see the direct relationship between the motion they are controlling and the resulting graph. However, this can be very frustrating for some players, particularly those who are using a trackpad on a Chromebook, as it can be difficult to physically control the square’s motion that precisely.
Ultimately, I decided the Control Mode is useful to introduce the activity, but the Input Mode is more user friendly and provides the teacher with better feedback of student understanding. I built a short activity to have my students play with this, and most of them shared that it was a helpful learning tool. Some students were confused between the difference between the two modes, so I will need to be more clear with instructions if I use it in the future. One student had difficult with the Input Mode, and through our discussion, several of his misconceptions about motion and graphing were revealed so I was able to address them. Although the student found the game frustrating, I think it still served the purpose because he was able to better understand motion graphs following our conversation, which might not have taken place if the game had not highlighted his misconceptions. The main menu of the game displays a scoresheet of the number of levels the player has completed. To assess student understanding, I created a brief Google Form with multiple choice questions about motion graph trends and asked students to upload a screenshot of the main menu scoreboard for the Input Mode. The multiple choice questions provided me with valuable feedback of which students understood the key trends and shapes of motion graphs, while the score board indicated which students had mastered interpreting numerical representations in motion graphs.
Tool 3: Equatio
I first learned about Equatio (I am using it through a Google Chrome extension, although it can also be downloaded on PC and Mac OS) through colleagues in the math department at my school who shared that it “totally transformed” their ability to teach math digitally. Thinking it would be helpful in physics class (a very math intensive subject), they recommended I try it out. I installed it at the start of this school year and used it as an equation editor – a tool to neatly insert formatted equations and symbols into Google Docs. I actually found that I was using Equatio to record calculations in homework assignments for my graduate courses more than I was in my teaching, since it is early in the year and I have not yet introduced too many lengthy equations to my students. At the surface, Equatio has the affordance of being able to interpret typed words or phrases and convert them into mathematical equations. Rather than hunting around for specific symbols or operators as I have done in the past with tools such as Microsoft Equation Editor, I can simply type “x^2” and “x2” shows up on the screen. Incidentally, I only recently discovered this and had been using “xsup2” to get the same result – an extra couple keystrokes, but still much more efficient than clicking around with a the mouse. As a teacher who has to develop worksheets of multiple sample problems for students to work through on a regular basis, this increased efficiency adds up to huge time savings over the course of a year. As I get faster with this input method, I am approaching the point where I can write out math almost as fast as I can type sentences – Equatio is a time saver and really cleans up my worksheets. But it is soooo much more!
I signed up for a seminar lead by an Equatio representative last Friday, hoping to pick up a couple tips and tricks, but not expecting much more than that. I was pleasantly surprised to learn that I have only tapped into a fraction of Equatio’s capabilities. Most of Equatio’s functions promote great opportunities for student learning, not just teacher efficiency. I realized that I had basically ignored almost all of the tools available because they hadn’t seemed relevant for what I needed.

Through the training I was exposed to each of the other tools on the toolbar, and have since been playing to see which functionalities will most benefit my students. The following is a list of my top three applications to use with students.
A. Various Input Modes (Image Scan, Handwriting Recognition, Equatio Mobile)
Equatio Image Scan offers the ability for students to upload images of handwritten work into a Google Doc (or many other document formats), where it is interpreted and converted into a text-based equation. I know that OCR scanning technology is not a new concept, but historically they have not been very accurate when transcribing math formulas. Writing out problems by hand is a very useful way to engage the brain in problem-solving, so while typing out equations is helpful for presenting completed problems, it can’t completely replace the pencil and paper as a processing tool. Equatio allows the student to benefit from the affordances of a low-tech writing implement, but then upload their work (into a Doc, Google Form, or other format) to be further manipulated (if necessary) and submitted. The process is very easy – take a quick picture with a cell phone (or other device) and upload the image to Equatio. In the age of remote learning, all of my students are on a device (Chromebook or laptop preferred) to join our class stream. I was pleasantly surprised that I could actually use a webcam (which they already have for attending class) to take a photo of handwritten work, and that Equatio accurately represented my handwriting with text.
The main function of this tool is increased accessibility. I plan to ask students to use the image scan feature when uploading work for assessments so that I can review their problem solving process. I was an AP reader for the AP Physics C exam this year, and having read through hundreds of student responses, I can say that typed responses are easier to grade than photos of handwritten responses almost 100% of the time. I already knew this through my teaching experience, but grading this many assessments on a screen at one time really drove that point home. Aside from being easier for the teacher to assess written work, the image scan could allow students to easily pull equations or sample problems from their notes to embed in a lab report or other activity. It really serves as a nice bridge between paper and digital media.
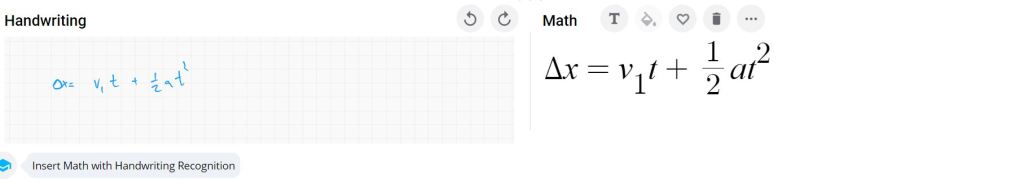
Similar to the Image Scan feature, Handwriting Recognition will read handwriting done on the screen and convert it into text. This is also not ‘new’ technology, but many applications that I have used fail to interpret mathematical equations correctly. In playing with the handwriting recognition feature, I found that it was better than most similar tools I have used before, although not perfect. A sample of my handwriting and the resulting conversion is shared below. My handwriting is not always the neatest, but Equatio did a pretty good job reading it. Given the likely need for frequent corrections when I write quickly, I think that typing would still be faster for me, but this option is one worth making available for students who have access to a touch screen/stylus and might prefer this method.
Equatio Mobile allows students to connect to Equatio in a document on their computer by scanning a QR code on their mobile device. This enables the student to use Math OCR, Handwriting, and Speech Input on their mobile device to insert into any document. While I did not successfully get the Speech Input feature to work well due to my hardware issues at the time of testing, I am assuming it would work well for students with a functioning device, which provides an amazing option for those with handwriting difficulties. The flexibility of input options is astounding and could really make it easier for students to more clearly organize and document their problem solving efforts in physics (and other math intensive subjects).
B. Draw Feature and Shape Library
Equatio has the option to provide a grid backdrop that can be drawn on freehand, with straight lines, “shapes”, and “smart shapes”. The possibilities here are endless. Most word processing software packages come with some sort of drawing feature and a small library of shapes to embed. Equatio has an incredible list of shapes, many that are direct representations of science and engineering symbols. There is a very extensive list of symbols that could be included in a schematic diagrams, the technique that engineers use to represent electrical circuits. I teach basic schematics in my classes when exploring electricity, and often I have students build circuits based on schematics that I provide. Traditionally I would also have students calculate the equivalent resistance of a circuit (what resistance would a resistor need to have in order to replace all other resistors in the circuit), but generally I wouldn’t have them create schematic diagrams as it is a time intensive process and the results are often messy and difficult to read. The Shape Library could bring this activity to the transformation level, as students could design and construct their own circuits, then use this tool to document what they created and observed. Students could create neat and organized representations of circuits and challenge other students to build a different circuit of equivalent resistance.

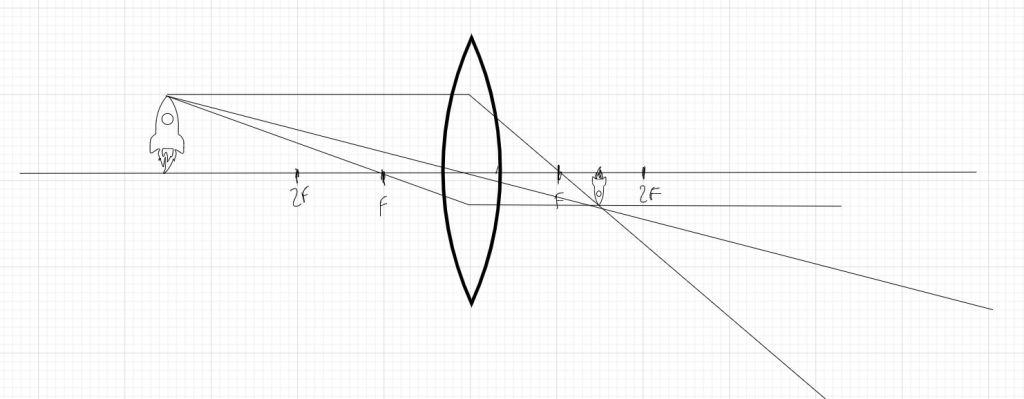
Another potential project idea that I could use the Shape Library for would be student exploration of Ray Diagrams. For years, I have taught students to create ray diagrams to predict where a lens or mirror would produce an image and the characteristics of that image (would it be smaller/larger, inverted/upright, real/virtual). When ray diagrams are drawn to scale, they produce a great visual alternative to algebraic problem solving. Understanding how to create ray diagrams can be challenging for some students and since they must be drawn precisely to scale, students would need access to a ruler. Due to these challenges, we opted to omit ray diagrams from our instruction last spring when our district shifted to remote learning due to the COVID-19 pandemic. With access to Equatio Shapes, it suddenly becomes much easier for students to create functional ray diagrams, and it is actually faster than drawing them by hand. In the sample below, I created a ray diagram to represent an image formed by an object (the rocket ship) when it is placed more than two focal lengths away. I was able to use the grid in the background as a measuring tool to make sure that all measured distances were proportional, and the result is exactly as I would predict (smaller, inverted, and real). This tool also allows students to easily manipulate the rays in the diagram to explore how the image changes with slight changes of the object location. There are other tools available that allow for students to conduct similar manipulations, but I think that allowing students to modify the diagram that they had created would provide a student with better insight as to how this technique works. Equatio allows students to create ray diagrams so much more efficiently as compared to the traditional method, which would enable them explore multiple configurations. Generally the number of scenarios students explore in class is limited due to time constraints. The ability for students to easily construct accurate ray diagrams quickly and then be able to adjust the diagrams to explore new configurations suggests that this activity is at the modification level on the SAMR scale. I think that many students would actually prefer to create ray diagrams using this tool rather than by hand, and the increased ease of using this method would allow me to teach it in the future, even if in a remote setting.
It is worth mentioning the “Smart Shapes” are objects that can be interacted with to some degree (ie a clock that you can set to display a specific time, a fraction wheel that you can cut into a specific number of segments). Several of these seem better suited for a younger student audience, but I think the protractor and ruler could be helpful in allowing physics students to solve vector problems graphically. Similar to the ray diagrams mentioned above, we have discussed omitting this technique due to the difficulty for students practicing this remotely without live feedback. Perhaps Equatio could allow students to explore vector addition digitally. I will have to look into this further and discuss with the other physics teachers on my team before implementing in my classes, but it looks promising.
C. Desmos
Desmos is a stand-alone tool that I was previously aware of, but now Equatio has integrated it directly into the interface. Desmos is POWERFUL, and I have only just scratched the surface. Desmos is a highly customizable graphing tool, allowing students to plot data points or functions while allowing the freedom to include constants and variables that are adjustable with slider bars. This allows students to see the direct effect that each value in a function has on the shape of a graph (changing slope, intercepts, etc). I have seen members of the PrettyGoodPhysics community share some very exciting simulations that they have created for students with Desmos, exploring topics such as projectile motion, conservation of energy, and much more. These simulations allow students to modify key variables and explore the outcome. Using pre-created simulations is not a perfect substitute for traditional lab activities where students can manipulate physical objects, but it is a great tool to have at their fingertips when they need to confirm their understanding of a concept. A way to transform this activity would be to teach students how to use the key features in Desmos and have them develop simulations of a physics phenomena. This is a great opportunity for assessment of learning and assessment for learning. I could measure student understanding of the content, and they would develop new skills through demonstrating the mastery of the physics.
Concluding Thoughts
All of the tools that I explored this week demonstrate significant potential to improve student informational literacy skills, particularly in the realms of visual literacy, computer literacy, and problem-solving. The challenge of integrating many new tools into a course is that significant instructional time needs to be invested at the onset of an activity to teach students how to use a tool, but if the tools are effective, this initial investment would pay dividends in the long run. Of the three tools explored above, Equatio seems to have the biggest return on investment, as the variety of tools are relevant to a myriad of physics topics. Physicsclassroom.com is simple enough that after a short introduction, students could probably navigate the site on their own to find helpful resources (also providing practice with “Searching” literacy skills). Motion Mapper is a one-time use tool – it is only relevant for exploring motion graphs, but if students were given a properly scaffolded assignment using this tool, I think it would warrant continued use in future years. Visual literacy is a critical science skill that often remains underdeveloped in high school science students. Embedding intentional opportunities to practice these skills into our curriculum using tools such as those that I have explored this week could significantly improve student proficiency in this area. This would allowing students to achieve a higher level of informational literacy, ultimately better preparing them to be global citizens in an increasingly information-dependent world.
